

Understanding Bullish Engulfing Patterns: Examples and Implications
Bullish engulfing patterns are crucial for traders as they signal potential trend reversals in financial markets. Identifying these patterns can help traders enter long positions at the beginning of an uptrend. This pattern is characterized by a small red (bearish) candle followed by a larger green (bullish) candle that engulfs the previous day's body. Understanding and utilizing bullish engulfing patterns can enhance trading strategies and improve decision-making for entering and exiting trades.
Examples and Implications
We hope you found this article helpful. A special thanks to FBS Broker for making it possible.
What is a bullish engulfing pattern?
This pattern is a popular candlestick pattern in technical analysis that signals a potential reversal of a downtrend. The pattern consists of two candlesticks: the first is a bearish candle followed by a larger bullish candle that completely engulfs the body of the previous candle.
What does it mean?
It’s a strong signal of a potential trend reversal from bearish to bullish, making it an essential tool for identifying entry points for long positions.
This candlestick pattern is significant because it represents a shift in market sentiment. The bearish candle reflects selling pressure and a downtrend, while the subsequent bullish candle indicates strong buying interest and a potential reversal. Traders interpret this pattern as a sign that buyers have overwhelmed sellers, suggesting that prices will likely move higher soon.
To effectively utilize this pattern, you might want to look for confirmation from other technical indicators, such as increasing trading volume or additional candlestick patterns.
How do you interpret and use it?
Interpreted as a strong buy signal, a bullish engulfing pattern is often used to identify entry points for long positions and to capitalize on price movements in the financial markets.
Additionally, you may look for confirmation from other technical indicators, such as increasing trading volume or additional candlestick patterns, to strengthen the validity of the signal.
Understanding the implications of this pattern will help you make informed decisions and anticipate market movements effectively. You will gain valuable insights into market sentiment, improving your trading strategies.
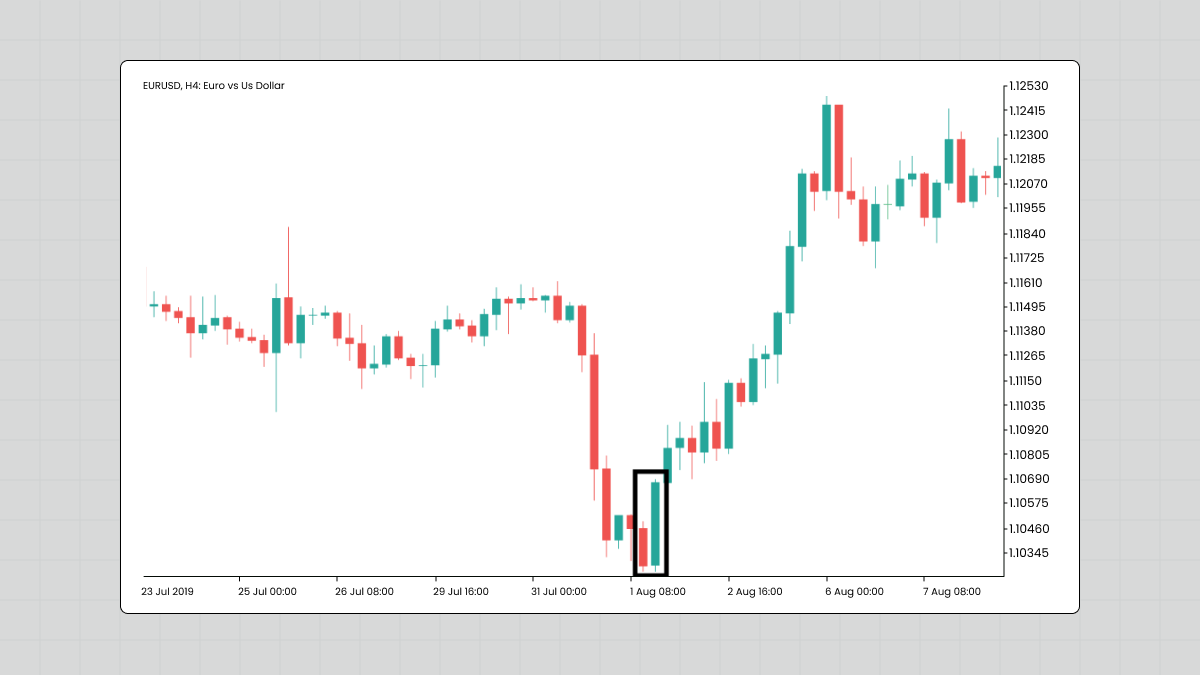
Example
Let's say you are looking at a price chart of a stock, and you notice the following two consecutive candlesticks:
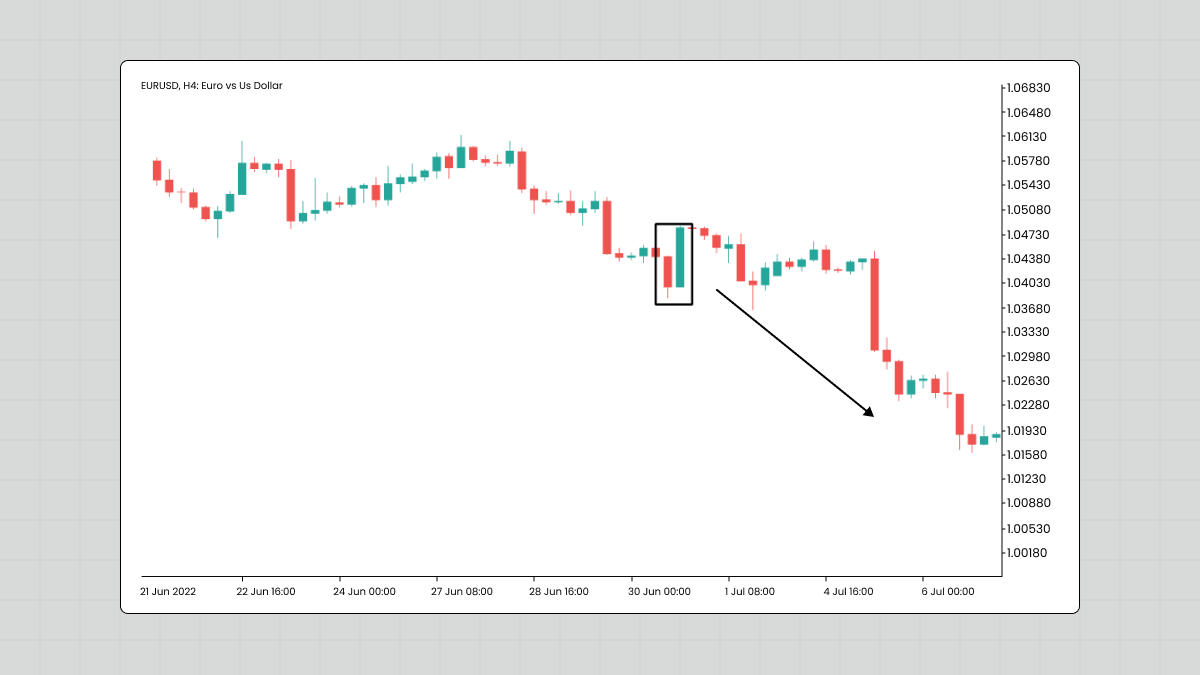
Day 1. The first candlestick is a small bearish candle, indicating a slight decrease in price, with the opening price higher than the closing price.
Day 2. The second candlestick is a larger bullish candle that completely engulfs the body of the previous day's candle, with the opening price lower than the closing price.
This formation, where the bullish candlestick completely engulfs the previous day's bearish candlestick, represents a bullish engulfing pattern. It indicates a potential reversal from a bearish trend to a bullish trend, indicating increased buying pressure and possible upward price movement.
You can interpret this pattern as a signal to enter long positions or consider buying opportunities in anticipation of a continuation of the stock's upward momentum. Again, confirmation through volume analysis or other technical indicators can further strengthen the validity of this pattern.
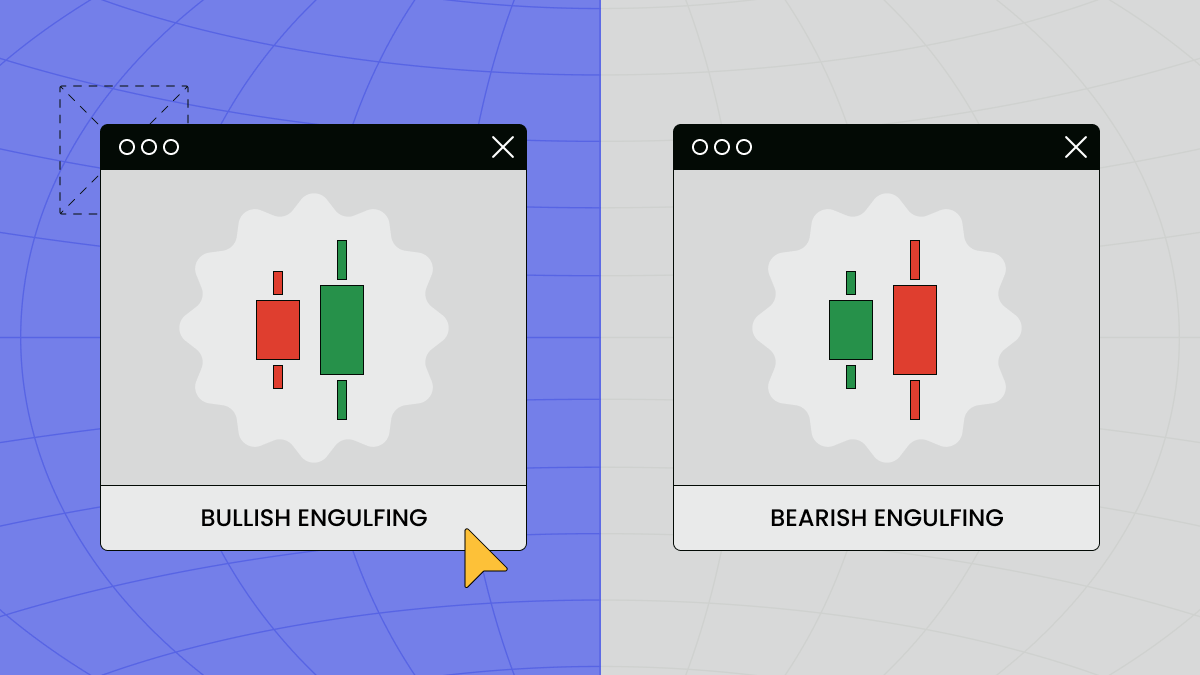
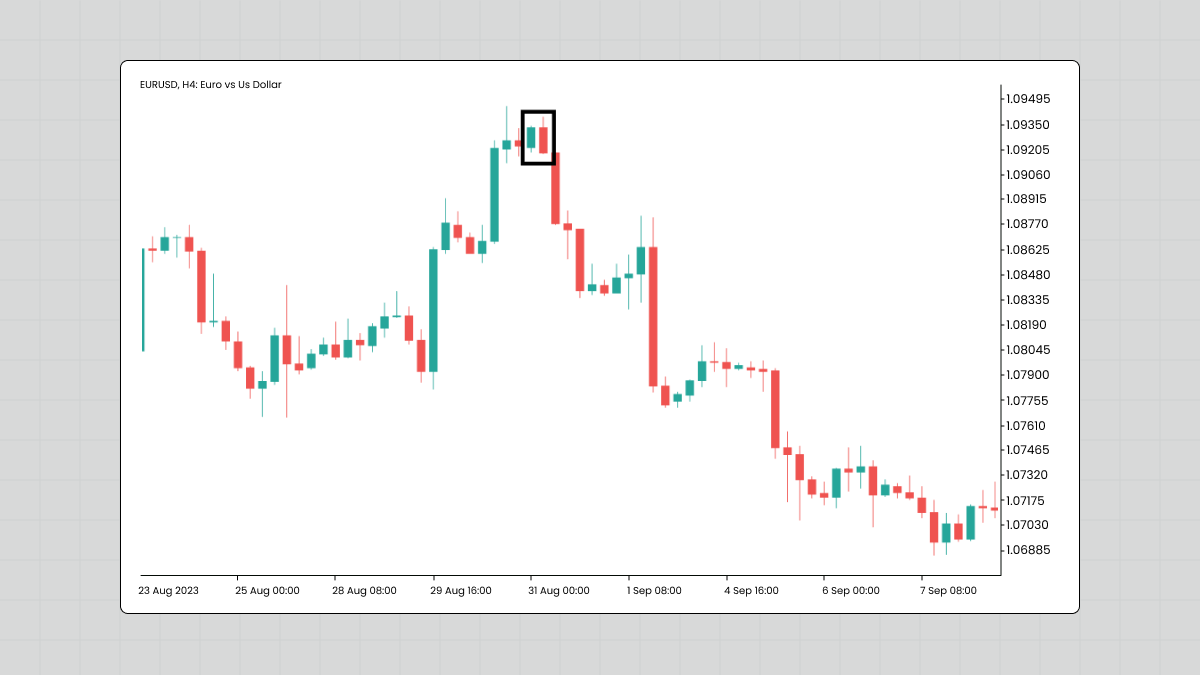
Bullish vs. bearish: comparing two engulfing patterns
|
Bullish engulfing pattern |
Bearish engulfing pattern |
|
Definition |
Consists of a smaller bearish candle followed by a larger bullish candle that completely engulfs the body of the previous candle, signaling a potential trend reversal from bearish to bullish. |
Comprises a smaller bullish candle followed by a larger bearish candle that engulfs the body of the previous candle, indicating a potential shift from bullish to bearish sentiment |
Interpretation |
Considered a bullish reversal signal, the pattern suggests increased buying interest and potential uptrend continuation. |
Viewed as a bearish reversal signal, it indicates heightened selling pressure and potential downtrend continuation. |
Market sentiment |
Reflects a shift in sentiment from bearish to bullish, with buyers overpowering sellers. |
Indicates a change in sentiment from bullish to bearish, with sellers dominating buyers. |
Trading strategy |
Used as a buy signal to enter long positions and capitalize on potential price increases. |
Employed as a sell signal to enter short positions and profit from potential price declines. |
Confirmation |
Traders may seek confirmation from increasing trading volume or other technical indicators to validate the signal. |
To strengthen the validity of the pattern, confirmation can be sought through additional bearish signals or technical analysis tools. |
Bullish engulfing candle reversals
A bullish engulfing candle reversal signals a potential reversal from a downtrend to an uptrend, indicating increased buying pressure and potential upward price movement. Traders often interpret this pattern as a signal to enter long positions or consider buying opportunities. Confirmation through volume analysis or other technical indicators can further validate the pattern.
Successful recognition of the bullish engulfing pattern can help you capitalize on potential price reversals and profit from upward market movements. Combine this pattern with other technical analysis tools for more accurate trading decisions.
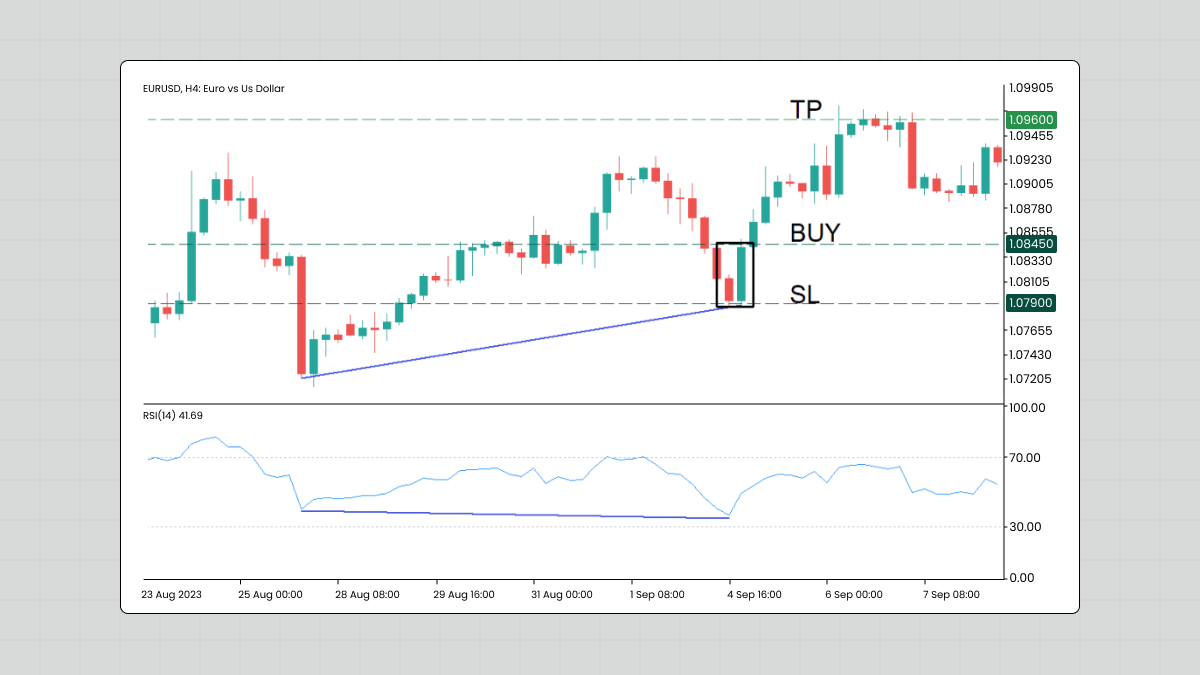
How do you act on a bullish engulfing pattern?
-
Identify the pattern.
-
Confirm with Volume.
-
Consider Market Context.
-
Enter Long Positions.
-
Set Stop-Loss.
-
Use Additional Indicators.
-
Monitor Price Action.
IMPORTANT: Remember to combine this pattern with other technical analysis tools – it can enhance the accuracy of trading decisions.
Things to consider when using engulfing patterns
False signals
Engulfing patterns can sometimes produce false signals, leading to incorrect trading decisions if not confirmed by other technical indicators or market context.
Subjectivity
The interpretation of engulfing patterns can be subjective, as different traders may have varying criteria for identifying and validating the pattern.
Lack of context
Engulfing patterns should be considered within the broader market context, as isolated patterns may not always lead to significant price reversals.
Overlapping candles
In some cases, engulfing patterns may occur due to overlapping candles or noise in the price chart, making it challenging to distinguish valid signals.
Market volatility
High market volatility can increase the likelihood of false signals and reduce the reliability of engulfing patterns as a standalone trading strategy.
Risk management
Engulfing patterns alone may not provide sufficient information for effective risk management, requiring additional tools such as stop-loss orders and position sizing.
Timeframe dependence
The effectiveness of engulfing patterns may vary across different timeframes, requiring traders to consider the timeframe that best suits their trading style.
Confirmation bias
Traders may exhibit confirmation bias by solely relying on engulfing patterns without considering other technical analysis tools or fundamental factors.
Historical performance
Past performance of engulfing patterns does not guarantee future success, as market conditions and dynamics can change over time.
Limited predictive power
Engulfing patterns are just one of many candlestick patterns and should be used in conjunction with other technical indicators for more robust trading decisions.
FAQ
What is a big bearish engulfing pattern?
A big bearish engulfing pattern is a two-candle pattern where a large bullish candle is followed by a larger bearish candle that engulfs the high and low of the previous candle, indicating a potential reversal from bullish to bearish momentum.
How strong is bullish engulfing?
Bullish engulfing patterns indicate strong potential for a bullish reversal, especially when they occur at key support levels or after a prolonged downtrend. However, it's important to look at other technical factors for confirmation.
Is bullish engulfing buy or sell?
Bullish engulfing is a bullish pattern. This means it’s a buy signal that indicates the potential for a bullish reversal. It suggests that buyers have overwhelmed sellers, signaling an opportunity to enter a long position.


