
EUR/USD Market Analysis 07/15/2024
This EUR/USD market analysis, provides an in-depth review of the currency pair across 1-hour, 4-hour, and daily charts. It highlights key support and resistance levels, potential reversal zones, and trading opportunities based on technical patterns. Get the latest EUR/USD market analysis for July 15, 2024. Our comprehensive review covers multiple timeframes, identifying critical support and resistance levels, potential reversal zones, and key trading opportunities. Stay informed with our technical analysis to make better trading decisions.

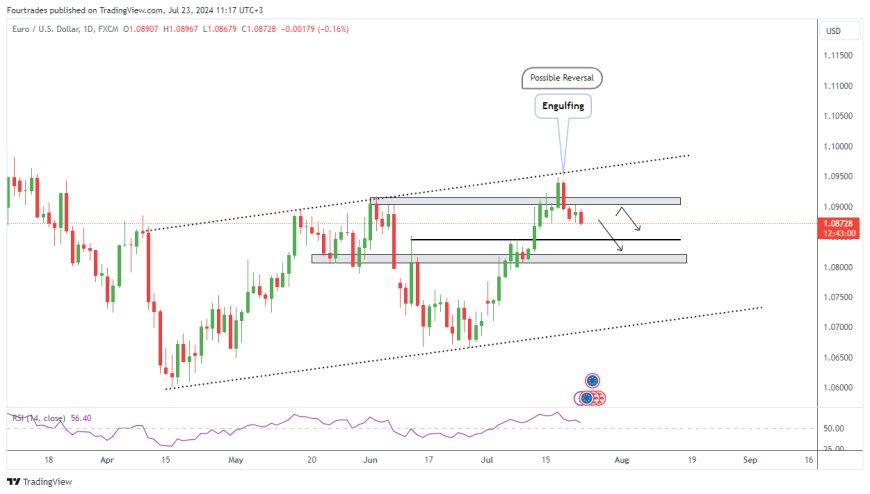
Daily Chart Analysis
Overview
The daily chart of EUR/USD shows a potential reversal signal. After a prolonged upward trend, the pair has recently encountered resistance and formed a bearish engulfing pattern.
|
Market Analysis ⇓ |
Key Observations
- Bearish Engulfing Pattern: A bearish engulfing candlestick pattern has formed at the top of the ascending channel. This pattern often signals a reversal, suggesting that the upward momentum might be coming to an end.
- Ascending Channel: The pair has been trading within an ascending channel, but the recent price action indicates a possible break to the downside.
- Support and Resistance Levels:
- Resistance: Near 1.0950, reinforced by the upper boundary of the ascending channel.
- Support: Key support levels are identified at 1.0850 and 1.0800, which align with previous horizontal support zones.
 |
Technical Indicators
- RSI (Relative Strength Index): The RSI is showing a bearish divergence, with the price making higher highs while the RSI is making lower highs. This divergence suggests weakening bullish momentum and potential downside ahead.
Conclusion
The daily chart indicates that EUR/USD might be gearing up for a reversal. Traders should watch for a confirmed break below the 1.0850 support level to validate the bearish scenario.
4-Hour Chart Analysis
Overview
The 4-hour chart provides a more detailed view of the recent price action and supports the bearish outlook observed on the daily chart.
Key Observations
- 20 EMA: The 20-period Exponential Moving Average (EMA) is positioned above the market price, acting as dynamic resistance.
- Descending Triangle: The price action has formed a descending triangle pattern, a bearish continuation signal.
- RSI Lower Highs: The RSI is making lower highs, indicating weakening momentum.
Support and Resistance Levels
- Immediate Support: 1.0850. A break below this level could trigger further declines.
- Next Support: 1.0800, coinciding with previous support levels and a potential bearish target.
Conclusion
The 4-hour chart reinforces the bearish sentiment. Traders should look for a break below the 1.0850 support level as a potential entry point for short positions.
1-Hour Chart Analysis
Overview
The 1-hour chart offers a closer look at the intraday price movements and key levels.
Key Observations
- Bearish Candlestick Pattern: A bearish engulfing pattern is visible on the 1-hour chart, aligning with the bearish signals from higher timeframes.
- Resistance and Support:
- Resistance: Around 1.0875, close to the 20 EMA.
- Support: Immediate support at 1.0850, with further support at 1.0800.
Technical Indicators
- RSI: The RSI on the 1-hour chart is also showing bearish signals, confirming the potential for further downside.
Education10 Trading Quotes that Will Change Your Trading Daily routine of successful traders |
Conclusion
The 1-hour chart confirms the bearish outlook, with a bearish engulfing pattern and key support levels to watch. A break below 1.0850 could be an opportunity for short-term traders to enter bearish positions.


