

GBP/USD Market Analysis
Get the latest GBP/USD market analysis, including key support and resistance levels, price action insights, and trade setup suggestions. Discover potential entry and exit points for maximizing trading opportunities in the forex market.
1-Hour Chart Analysis GBPUSD by Fourtrades on TradingView.com
| Trade Now >> |
| Todays Signals >> |
| Market Analysis ⇓ |
Daily Chart Analysis
The GBP/USD pair is currently trading within a well-defined ascending channel on the daily chart. This channel has been respected for several months, indicating a strong bullish trend. Recently, the price approached the upper boundary of the channel but faced resistance, causing a pullback. The key support level within this channel is around 1.2900, where previous resistance has turned into support.
|
Market Analysis ⇓ |
Key Observations:
- Channel Resistance: The upper boundary of the channel, around 1.3150, is acting as a significant resistance level.
- Support Zone: The area around 1.2900 is crucial as it represents the channel's lower boundary and a previous resistance level now turned support.
- Potential Scenarios: A break above the channel could signal a continuation of the bullish trend, with the next target around 1.3300. Alternatively, if the price fails to break above and falls below the support at 1.2900, a deeper correction could be expected, possibly toward 1.2750.
Education10 Trading Quotes that Will Change Your Trading Daily routine of successful traders |
4-Hour Chart Analysis
On the 4-hour chart, GBP/USD shows a potential reversal pattern with a bearish divergence on the RSI. The price has been forming lower highs, while the RSI has been making higher highs, indicating weakening bullish momentum.
Key Observations:
- Resistance Levels: The 1.2950 and 1.3000 levels are immediate resistance points that the bulls need to overcome for further upside.
- Support Levels: The support at 1.2900 is crucial. A break below this level could lead to a decline towards 1.2850 or even lower to 1.2800.
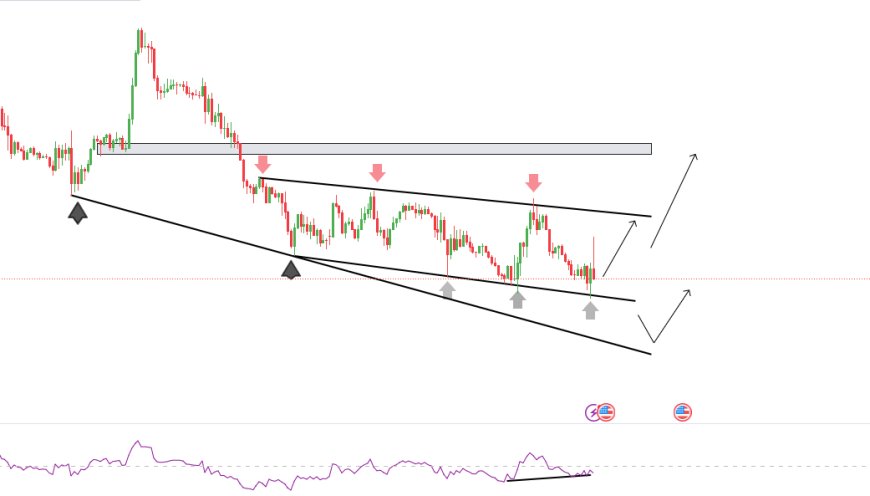
1-Hour Chart Analysis
The 1-hour chart provides a closer look at the short-term dynamics. The price recently broke above a descending trendline, suggesting a potential short-term bullish reversal. However, the price action remains choppy, with several resistance and support levels to watch.
Fourtrades Trusted Broker ⇓
|

Key Observations:
- Immediate Resistance: The 1.2950 level is a key resistance point. A break above this level could lead to a test of 1.3000.
- Support Levels: Immediate support is around 1.2920, with stronger support at 1.2900.
Conclusion
The GBP/USD pair is currently at a critical juncture. The daily chart shows a well-defined ascending channel, with the price testing key resistance levels. The 4-hour and 1-hour charts indicate potential bullish momentum, but significant resistance levels need to be cleared for a continuation of the upward trend. Traders should closely watch the 1.2900 support level and 1.2950 resistance level for potential breakout or breakdown scenarios.

07/24/2024


